Build a searchable repo of Data Science resources from Twitter
Twitter, Data Science and Shiny
I’m a Twitter user and I follow a lot of people who work in and around Data Science. This means I often see tweets from people which link to resources and tutorials that may one day come in useful. To ‘bookmark’ these tweets for a rainy day, I ‘like’ them. However, I rarely engage with the materials contained within those tweets because I didn’t have a useful and easy way of viewing them - Twitter’s search function is not ideal. So, I decided to build something that would enable me to search and explore my liked tweets based on the subject matter contained within them.
You can view what I built here. It’s an interactive, online document with links out to ~500 data science resources.
In this tutorial, I’ll walk through the process of making the app above, from gathering tweets to deploying the result.
All the code required is contained below, but you will first need to register for a developer account with Twitter and it may be useful to look at the documentation around creating markdown documents.
1 Gather your liked Tweets
Load in the packages below, enter in the Key and Secret for your Twitter account, and then gather your likes. I know that I’ve ‘liked’ just under 3000 tweets, so I am gathering up to that number. If you have liked more than that, amend the final line of code.
library(rtweet)
library(tidyverse)
library(tm)
library(stringr)
library(dplyr)

appname <- "THE NAME OF YOUR APP"
## api key (example below is not a real key)
key <- "YOUR KEY"
secret <- "YOUR SECRET"
access_token <- 'YOUR ACCESS TOKEN'
access_secret <- 'YOUR ACCESS SECRET'

twitter_token <- create_token(
  app = appname,
  consumer_key = key,
  consumer_secret = secret,
  access_token = access_token,
  access_secret = access_secret)

username <- "craigfots"
craig_faves <- get_favorites(username, 3000)
2: Filter results for data science terms
I often like tweets by my friends, or else if I find something interesting or funny. I want to ensure that the only tweets I see in my interactive document are those related to data science AND which contain links to articles, videos or tutorials.
To achieve this, first I search for data science terms. If you are building your own version, amend the words_to_keep vector accordingly. You’ll see from my list below that I’m looking for tweets that cover a number of different languages and tools, and a variety of subject areas.
craig_faves$lower_text <- tolower(craig_faves$full_text)

words_to_keep <- c("rstats", " r ", "rstudio", "tidyverse",
                   "python", "sql", "excel ",
                   "tableau", "power bi",
                   "nlp", "machine learning",
                   "shiny", "data vi", "cloud",
                   "data mining", "datamining", "web3",
                   "crypto", "blockchain", "deeplearning",
                   "neural", "neuralnetwork", "statistics",
                   "artificial", "artificial intelligence", "tensor")

craig_faves <- craig_faves %>%
  filter(str_detect(lower_text, str_c(words_to_keep, collapse = '|')))
Next, I search the liked tweets for URLs, extract those urls, filter out any tweets that do not contain a link, and then create a hyperlink that opens in a new window.
Finally, I write out the file that will sit behind the document.
url_pattern <- "http[s]?://(?:[a-zA-Z]|[0-9]|[$-_@.&+]|[!*\\(\\),]|(?:%[0-9a-fA-F][0-9a-fA-F]))+"
craig_faves$content_url <- str_extract(craig_faves$full_text, url_pattern)
craig_faves <- craig_faves %>%
  filter(nchar(content_url) > 0)
craig_faves$url <- paste0("<a href='", craig_faves$content_url,"' target='_blank'>","LINK","</a>")

write_rds(craig_faves, 'faves.rds')
3: Create your Runtime Shiny Markdown file.
Open a new .Rmd file and add the following code in the first ten lines. This will tell R that you are created a Shiny document.
---
title: "Your title goes here"
author:
date:
output:
  html_document:
    df_print: paged
    toc: false
runtime: shiny
---
Next, and if you want to, you can add some CSS styling.
<style>
  header{}
/* Applying style to entire document: */
body{
text-align: justify;
font-family: Tahoma;
font-color: white;
font-size: 11pt;
background-color: #ECECEC;

}

a[href*="//"] {
color: #191414;
font-weight: bold
}

a[href^="mailto:"] {
color: #191414;
font-weight: bold
}

</style>
Then, set up your document by loading the required packages, the data gathered in the earlier step, and a list of terms you would like users to be able to search on.
knitr::opts_chunk$set(echo = TRUE)

#Load Required R Packages
library(tidyverse)
library(DT)
library(lubridate)
library(readxl)
library(shinyWidgets)

faves <- readRDS('faves.rds')

langs <- c("rstats| r |rstudio|tidyverse", "python", "sql", "excel ", "tableau", "power bi")
names(langs) <- c("R", "Python", "SQL", "Excel", "Tableau", "Power BI")
langs <- sort(langs)
subjects <- c("nlp", "machine learning", "shiny", "data vi", "cloud", "data mining|datamining", "web3|crypto|blockchain|nft", "statistics", "deeplearning|neuralnet|neural|artificial|tensor")
names(subjects) <- c("Natural Language Processing", "Machine Learning",
                     "Shiny Dashboards", "Data Visualisation", "Cloud Computing", "Data Mining", "Web3, Blockchain, NFTs and Crypto", "Statistics", "Deep Learning, Neural Networks and AI")
subjects <- sort(subjects)
Next, create your user inputs. I have created two - one for languages and tools, another for subject areas. The pickers will be populated with the elements added in the preious step.
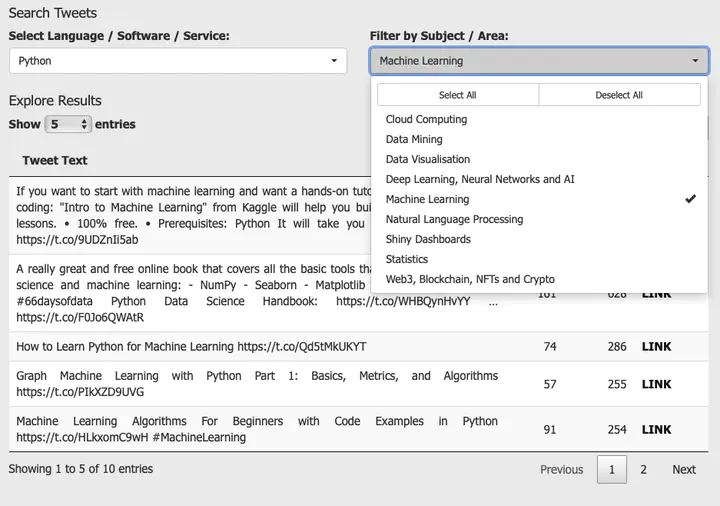
fluidRow(column(6,
         pickerInput("lang", "Select Language / Software / Service:",
                            choices = langs,
                            options = list(`actions-box` = TRUE),
                            multiple = TRUE, selected = "python", width = '100%')),
         (column(6,
          pickerInput("subject", "Filter by Subject / Area:",
                            choices = subjects,
                            options = list(`actions-box` = TRUE),
                            multiple = TRUE, width = '100%'))),)
Next, create a reactive dataframe that will filter all tweets for the terms selected by the user.
faves_new <- reactive({
  faves %>%
    filter(str_detect(lower_text, str_c(input$lang, collapse = '|'))) %>%
    filter(str_detect(lower_text, str_c(input$subject, collapse = '|'))) %>%
    arrange(-favorite_count,-retweet_count)
})
Finally, display the results in a datatable.
renderDT({
  faves_new <- faves_new()
  faves_new <- faves_new[, c(4, 19, 20, 46)]
  DT::datatable(faves_new,
                options = list(pageLength = 5),
                colnames = c("Tweet Text", "#RTs", "#Faves", "Content"),
                rownames = FALSE,
                escape = F)
})
When you run this document it will open locally. If you want to share the document, you can host it on ShinyApps.Io, as I have done with mine.
I hope you’ve found this tutorial useful. I’ve certainly got a lot of use out of my searchable repo, and have even started to make use of some of the links now that they are easier to search and interact with.
Please do drop me a line with a link if you make a similar Twitter repo; I’d love to see what you make.
Dr Craig Hamilton
My research interests include popular music, digital humanities and online cultures.